
If you’re interested in SEO or use Google Search Console to check your pages rankings, you’ve probably already seen or heard about Core Web Vitals. Core Web Vitals are new metrics introduced and used by Google to measure the quality of the user experience on your site.
But the main reason why you should take a closer look at Core Web Vitals is because Google has decided to integrate them into its algorithm around May 2021. This means that Core Web Vitals will have a real influence on the ranking of your pages in Google as of this year.
Since I’ve recently been optimizing our blogs to improve these metrics (which is not so straightforward by the way), I thought I’d share with you in detail what Core Web Vitals are and my tips on how to improve them on your WordPress site.
- What are Core Web Vitals?
- Tools to measure Core Web Vitals
- How to measure and improve Largest Contentful Paint (LCP) for WordPress
- How to measure and improve First Input Delay (FID) on WordPress
- How to measure and improve the Cumulative Layout Shift (CLS) on WordPress
- Does WordPress pay attention to Core Web Vitals?
- How will Core Web Vitals affect my google search results?
What are Core Web Vitals?
What Google calls the Core Web Vitals are in fact the metrics that measure for now three aspects of the user experience (which might evolve with time): loading speed, interactivity and visual stability.
If you’ve ever used tools to measure the performance of your WordPress site, you know that there are a lot of different metrics and it’s not always clear which ones are the most important. With Core Web Vitals, Google is looking to simplify this by placing more emphasis on the metrics that best reflect the experience of people visiting your site.
There are 3 Core Web Vitals at the moment:
Largest Contentful Paint (LCP)
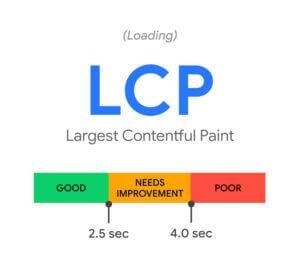
Largest Contentful Paint (LCP) measures the speed (in seconds) at which the most meaningful visible element is displayed during the loading of a page (more details on the LCP calculation here). The most meaningful visible element will be different for each site but it could be for example the featured image or the title of the article (I will explain below how to determine what is this element on your site).
This metric is important for the user experience because a visitor will have the impression that a page is loaded when the most meaningful visible element is displayed (for example the featured image in the header). LCP is therefore an interesting measure of the perceived loading speed of a web page.
To be considered good enough, LCP should ideally be less than 2.5 sec and in no case more than 4 sec.
First Input Delay (FID)
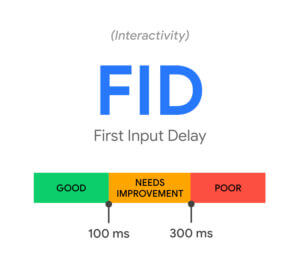
First Input Delay (FID) is a measure of the responsiveness and interactivity of your site. It measures the time (in milliseconds) that the browser needs to respond to the first user interaction with a page of your site (more details on the calculation of FID here).
Let’s take an example to clarify: Imagine you open a page on your mobile device and quickly click on a link. The FID will then be the time between the moment you touch the screen with your finger to click and the moment the browser actually redirects you to the link you clicked on.
Nowadays we often ask a lot of work from browsers by having CSS and JS intensive web pages. Often the browser is busy processing scripts and cannot respond immediately to a user’s interaction. So for the best possible experience, it’s important to keep FID as low as possible.
To be considered good, FID must be less than 100ms and not more than 300ms.
Cumulative Layout Shift (CLS)
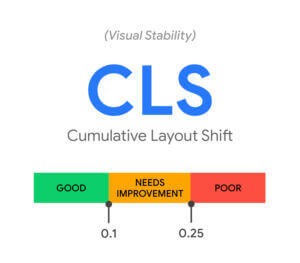
Cumulative Layout Shift (CLS) is a measure of the visual stability of your site. It measures the sum of visual shifts that occur during the loading of a web page (more details on the CLS calculation here).
It is quite easy to understand why this metric is important for the user experience. It’s never nice, for example, when a button moves just when you are about to click on it 😉 .
To be considered good, CLS must be less than 0.1 and definitely not more than 0.25.
In summary, here are the numbers you need to remember about these three metrics:
| Good | Needs improvement | Poor | |
| LCP | <=2.5s | <=4s | >4s |
| FID | <=100ms | <=300ms | >300ms |
| CLS | <=0.1 | <=0.25 | >0.25 |
Tools to measure Core Web Vitals

In my extensive guide to improve WordPress site speed, I talked about several tools to test your site’s loading speed. Among these tools, GT Metrix and WebPageTest have both moved to Core Web Vitals… Only Pingdom has not switched yet (so you don’t need to use this tool anymore before they switch to Core Web Vitals).
But as we are trying to please Google here, we will use their own measurement tools (which are very good by the way) to measure and improve the Core Web Vitals of our WordPress sites.
It is essential to differentiate between 2 types of data that are used by Google’s tools:
- Field data: This is data collected by Google about the experience of real users of your site. Google uses its Chrome browser to collect this data also called CrUX (chrome user experience)
- Lab Data: This is the data calculated from Lighthouse (the tool developed by Google to measure Core Web Vitals in simulated environments).
Lab data is crucial to be able to measure if the changes made on our sites are effective in improving Core Web Vitals (since it is calculated, we can see the changes immediately). On the other hand, Google will definitely use the field data for its algorithm as it represents the actual experience of the users on your site.
So below are the different Google tools you can use to measure Core Web Vitals.
Page Speed Insights (PSI)

Google Page Speed Insights is probably the easiest tool to use for most people. Just go to this page, enter the url you want to test, and voilà… the tool calculates your Core Web Vitals for this url in mobile and desktop version. Moreover the tool also gives you a complete audit and a list of suggestions to help you improve your scores. Here is an example of the PSI report for a novo-media article in mobile and desktop:
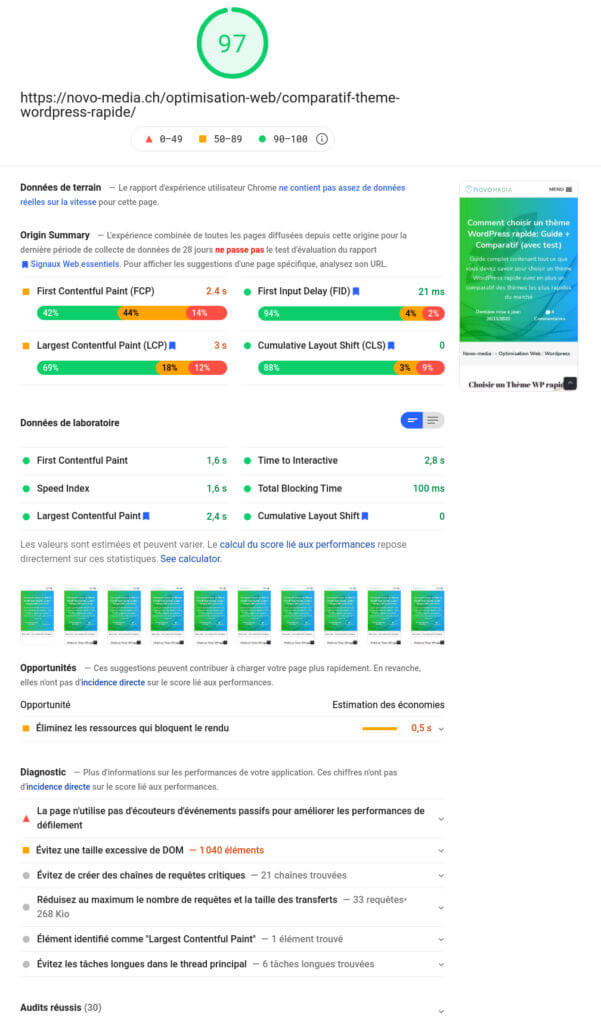
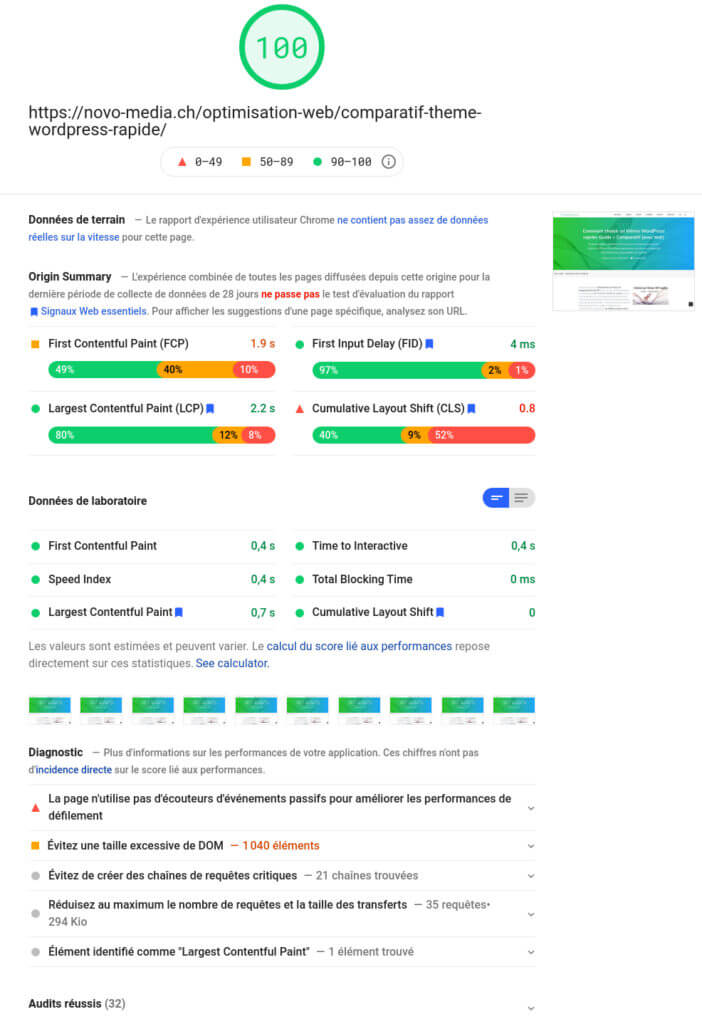
A few important points about this report:
- You should always look at the report for mobile AND desktop as the scores are often very different. In mobile version, lighthouse simulates a mid-range device with a rather slow connection speed (sth. like 2Mbps) while on desktop the connection is much faster. So in general, try to optimize your Core Web Vitals for mobile and you will automatically get good results in desktop version.
- You will notice that for this example, the field data is not available for this url and that PSI shows instead a summary of the performance for the domain over the last 28 days (Origin Summary). You need to have a lot of traffic on a url for the field data to be displayed.
- You can see that there is also a good difference between the Origin Summary results (field data) and the lab data. The reason is quite simple: As I had just made the changes to improve my Core Web Vitals, the lab data is good but these performances are not yet reflected on the field data which is based on the users of the last 28 days (hence the usefulness of the lab data).
Since this is the simplest tool, it’s the one I’ll use below to explain how to measure and improve the 3 Core Web Vitals.
Google Search Console

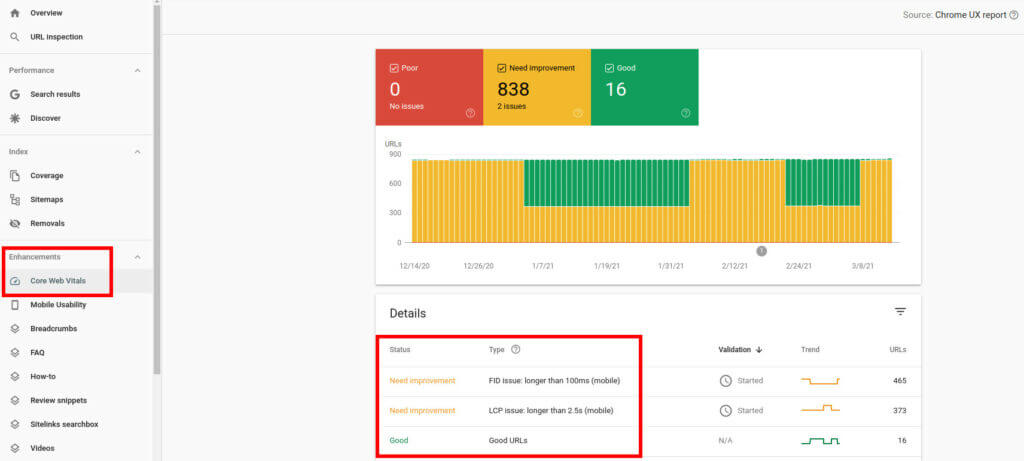
If you use Google Search Console from time to time (which I highly recommend you do 😉 ), you’ve probably noticed a “Core Web Vitals” tab in the left-hand menu for some time. Clicking on this menu will take you to a report that details the overall status of your Core Web Vitals for mobile and desktop on your site.
Here are some details to understand how to read this report:
- Unlike PSI, Google Search Console relies solely on the field data collected with the Chrome browser to calculate Core Web Vitals. This means that if you make improvements to your site, it will take some time to be reflected in the console results (we’re talking weeks).
- Google uses the 75% rule to indicate if a url passes the Core Web Vitals test. This means that if 75% of the visits measured by Google pass the LCP, CLS and FID test, this url will appear in green in the report. If only one of these criteria is not satisfied, the url will appear in orange or red in the report (see table of metrics above).
- If you click on one of the mobile or desktop reports, you will be able to see the details of which metric is causing problems on your site (if you don’t already have everything in green 😉 )
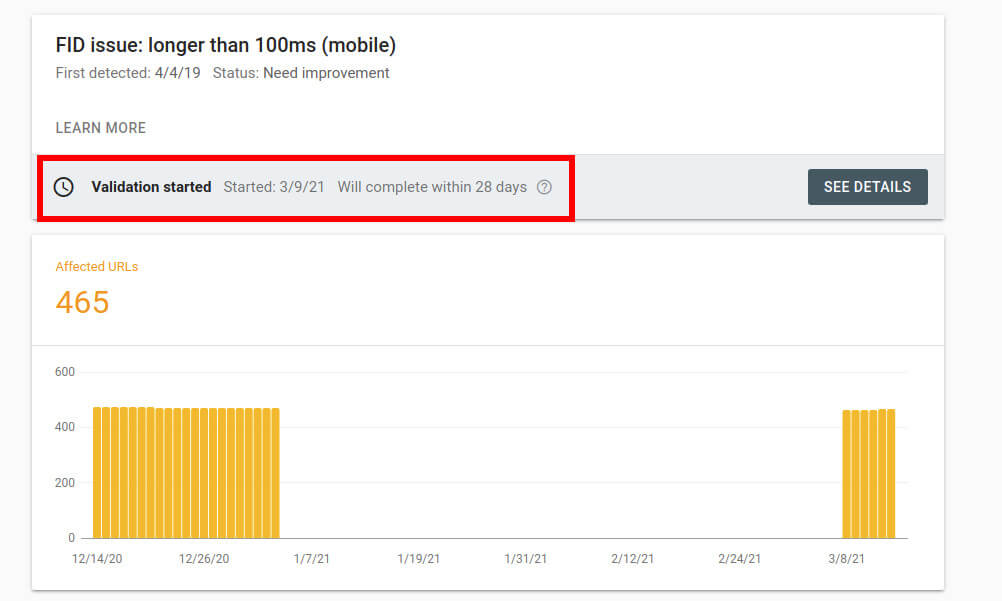
- If you make changes to improve your Core Web Vitals, Google provides a tool in the report details to validate your changes. Once you have validated your changes for an issue indicated in the console, Google will begin a 28-day observation period. If at the end of the 28 days no issues are detected, your scores will be updated in the console.
In summary, Google Search Console is a good tool to monitor and diagnose potential problems across your entire site using field data. To check if your changes are effective, you will need to use PSI and lab data.
Other tools to measure Core Web Vitals
While I think Page Speed Insight and Google Search Console are the most accessible tools for measuring Core Web Vitals, there are still others worth mentioning:
- Lighthouse in the chrome browser: If you right click and then “inspect” on a page of your site, you will find a “lighthouse” tab where you can audit the page you are on. This tool will give you essentially the same information as PSI… However, if the results differ a little between the 2 tools, it is because they do not use the same version of lighthouse (V7.1 for PSI and V6.4 in Chrome at the moment)
- Chrome UX report and Data Studio: You can also use Google Data Studio (there is a pre-made template from Google for this) to display Google’s CrUX field data per month for your sites. You can simply follow the steps outlined here to get such a report.
- The Web Vitals js library: If you really want to track in real time the Core Web Vitals of all your visitors, you will have to add this little javascript to your site. You can then connect it to Google Analytics or Google Tag Manager to see the experience of all your users directly in these tools. This is the most efficient way to measure Core Web Vitals but it requires more work to set up. More details on this subject here.
In the following part, I will show you how to use Page Speed Insights to analyze and improve the Core Web Vitals of your WordPress site.
How to measure and improve Largest Contentful Paint (LCP) for WordPress
As I explained earlier, the LCP metric measures the time it takes for the browser to display the most meaningful visible element on a page. So to improve LCP, you first need to know which element is considered the most meaningful on your pages in mobile and desktop version (because depending on your design, the LCP element will not necessarily be the same on mobile and desktop).
Measure Largest Contentful Paint with PSI
To do this nothing could be easier with PSI. Just test a url, scroll to the Diagnostic part and you will find the element identified as Largest Contentful Paint:
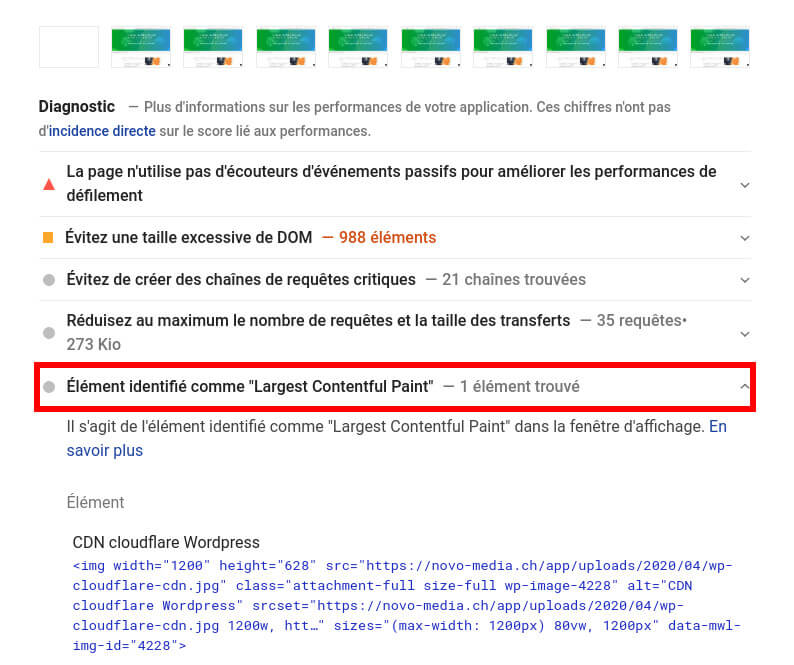
You can see in the screenshot above that, as expected, the element identified as LCP on novo-media is the header background image (this element is often an image for many sites). So in order to improve the LCP score (on novo-media), it is a question of making this image appear as quickly as possible.
Improve Largest Contentful Paint on WordPress
In order for the LCP element to display as fast as possible on your WordPress site, there are several things you need to optimize first. As I have already explained some of these topics in my guide to speed up WordPress site, I will refer to it several times below.
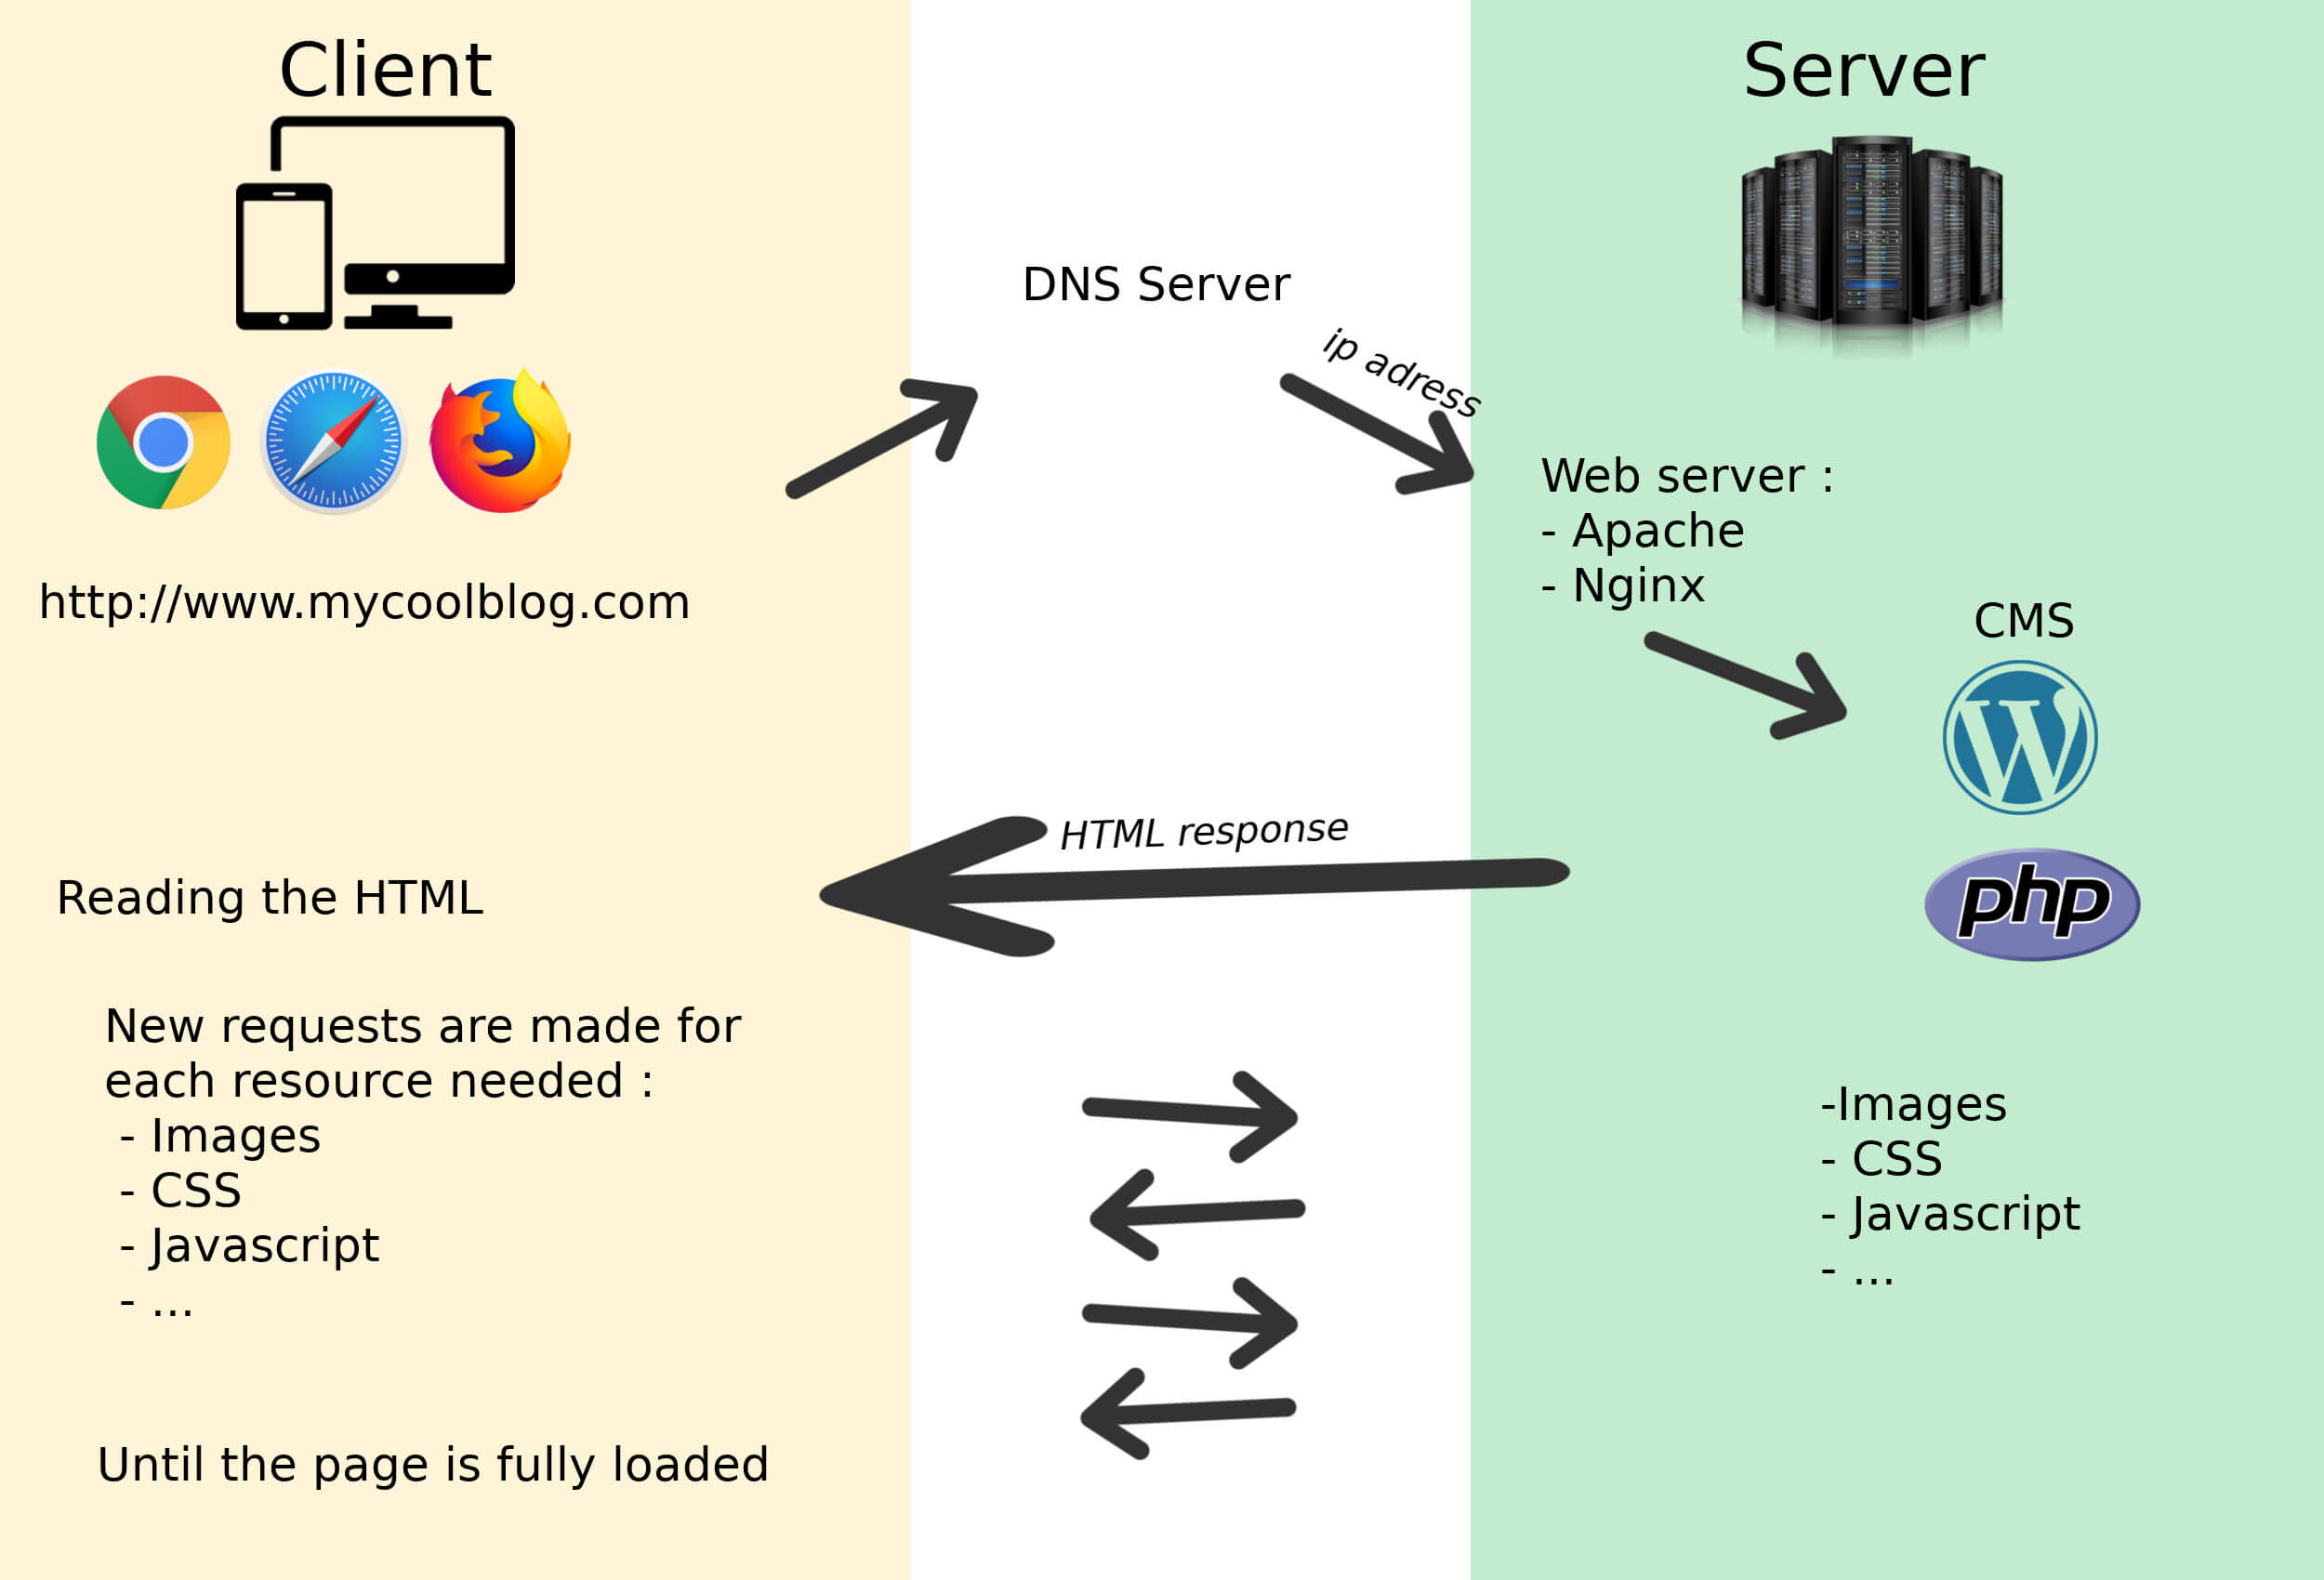
Reduce the TTFB (time to first bite)
Reduce the TTFB (time to first bite) of your site as much as possible: The TTFB is the time between the moment when a visitor requests a web page in his browser and the moment when the browser receives the first bite of the HTML response (see my diagram of an http request for a good understanding). To reduce it you need to enable page caching, configure browser caching, enable Gzip or Brotli compression on the server, if possible have a fast domain name provider and set up a CDN like CloudFlare if you have a global audience.
Optimise images
As I told you above, the LCP element is often an image. So it’s very important to compress and reduce the weight of all your images using an image compression plugin like EWWW or ShortPixel (I compared all the best image compression plugins here).

You also need to make sure that you have responsive images, i.e. that you display the right image according to the type and size of your visitors’ screen. Imagine that your visitors on mobiles load an image that is 2000pxs wide… it would have a VERY bad impact on the LCP! To have responsive images you have 2 possibilities:
- Either you use an image CDN that will take care of displaying the right images according to the type and screen size of your visitors from the closest server. EWWW and ShortPixels both offer a powerful image CDN service. It’s a bit more expensive than using them only for compression but if you’re not very tech savvy it’s the easiest way to get responsive images.
- Either you are a bit more tech-savvy and you make sure you have srcset and sizes attributes that correspond to your site’s design on mobile and desktop. For more details you can read my blog post on this matter here.
Lazy loading

Delay the loading of anything that is not visible on the screen (lazyload): You should avoid loading items (images, Iframes, videos…) that are not immediately visible on the screen and that could delay the download of the LCP element. To do this I can recommend you the excellent Lazy loader plugin or to use the lazyload option of WP Rocket.
Optimize the code
In order for the LCP element to be displayed as quickly as possible, you need to keep the size of your site’s JS and CSS files to a minimum. You should also make sure that you don’t load unnecessary scripts before the main content of your page (but I’ll come back to this point below as it’s a very important component of FID).
To give you really practical tips to improve the LCP of your WordPress site, there are 2 scenarios in my opinion:

- If you are not very tech-savvy: I suggest you invest some money to install the WP Rocket plugin (which takes care of page caching, browser caching, compression, lazyload, code optimization etc…) and use EWWW or ShorPixels with the CDN option to have light and responsive images.
- If you are tech savvy and know how to make some small changes in the code: In this case I recommend you to set up CloudFlare with the WP CloudFlare super page cache plugin (will drastically reduce TTFB). Then you will need to use EWWW or ShortPixels to compress your images while having optimal srcset and sizes attributes. You will need to use the Lazy Loader plugin to delay the loading of all elements that are not visible on the screen. Finally I recommend you to use the Fast Velocity Minify plugin to optimize the weight and the loading of your scripts. Be careful though because this plugin is not easy to configure and you could quickly break some features of your site if you are not careful (I might write an article about this plugin sometime).
How to measure and improve First Input Delay (FID) on WordPress
As I explained earlier, the First Input Delay (FID) is a reactivity metric that measures how fast the browser responds to the first interaction of your visitors. As you can imagine, it is impossible to simulate FID with PSI (since you need visitor interaction to calculate it) and it is a metric that is based solely on field data.
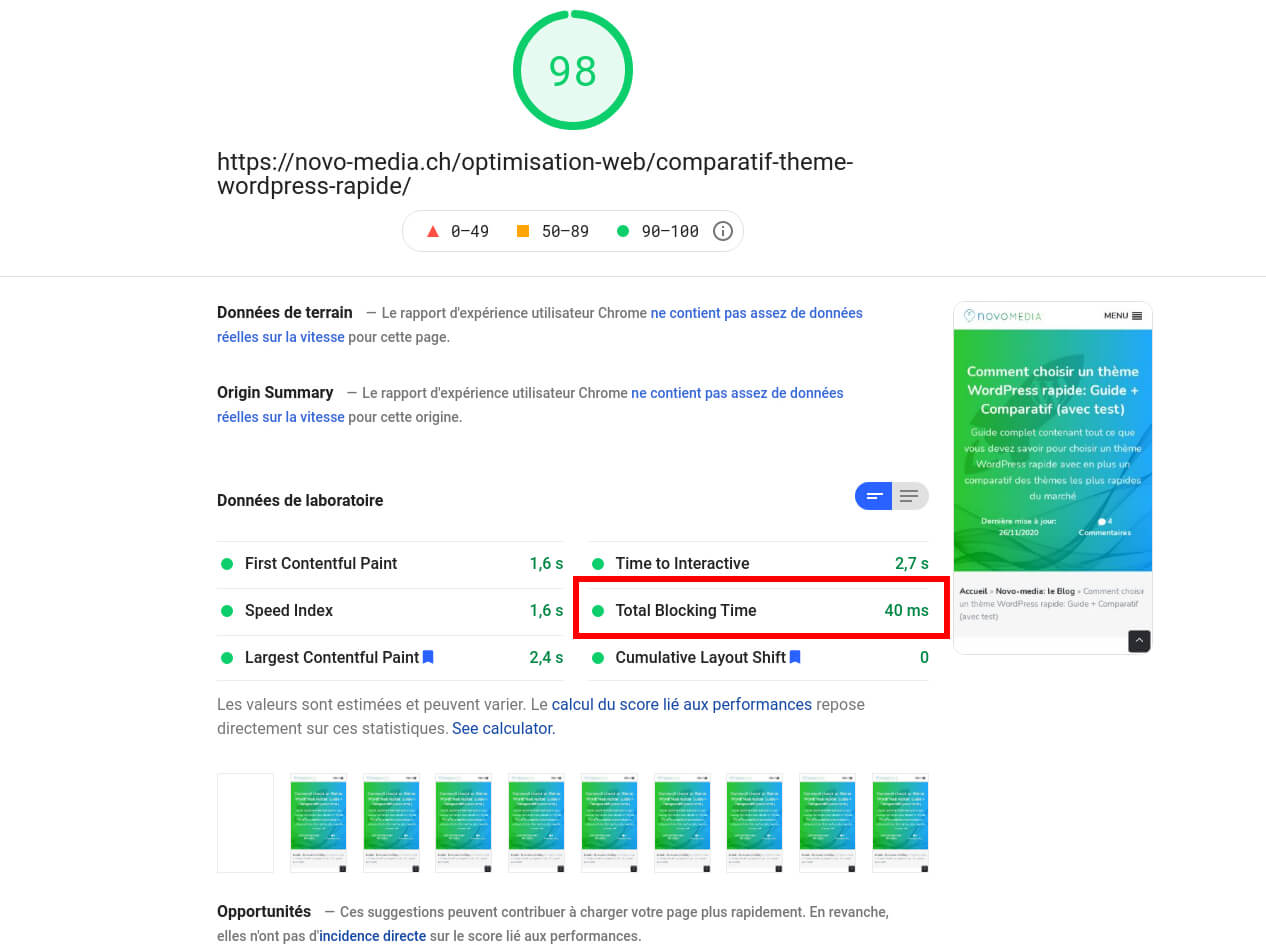
Measure the First Inpud Delay with PSI?
I just told you, it is not possible to measure the FID with PSI 😉 . But fortunately you will also find in the PSI report a metric called “Total Blocking Time“ (TBT) which even if it is not equal to the FID is generally proportional to the latter. So basically, if you manage to decrease your TBT, the FID will decrease too 😉 .
Let’s see now how to decrease the FID of your WordPress site:
Improve the First Input Delay on WordPress
Well, I will be honest, this is clearly the most difficult metric to improve and there is no plugin/method that allows you to improve FID automatically. To improve this metric, you should absolutely avoid running large js/css files during page load so that the browser can quickly respond to your visitors’ interactions. Even if it’s a bit complicated, I’ll try to explain you how you can do it by yourself.
In concrete terms, this means that you must absolutely delay (or even remove) the loading of all files that are not necessary for the display of the visible part of the page on mobile or desktop. The problem is that good practices in this regard are not very common on WordPress and that there are many plugins / themes that load huge js and/or css files on all pages of the site while you use these features only on a few pages.
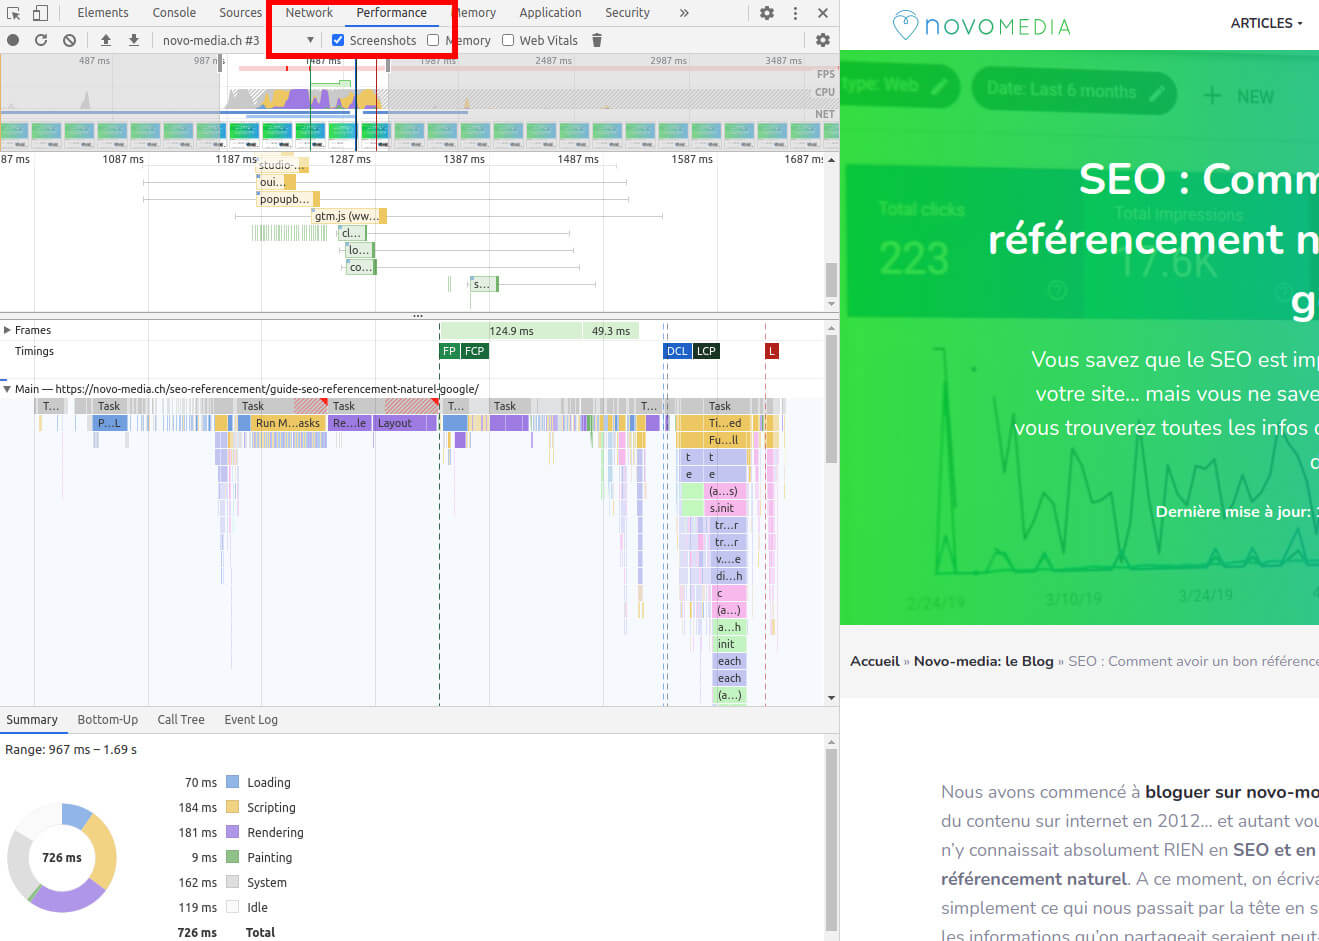
To diagnose where potential problems are coming from, I recommend that you first disable your code optimization plugins if you are already using some so that you do not combine js/css files. This will allow you to see which files are causing the most problems without them being combined and/or renamed. Then you could right click and inspect to use the “Network” or “Performance” tab to analyze your download waterfalls. But if you’re not a developer, these graphs are pretty hard to read and I’d recommend just using the PSI report instead because it will give you some good pointers on how to improve the most important things.
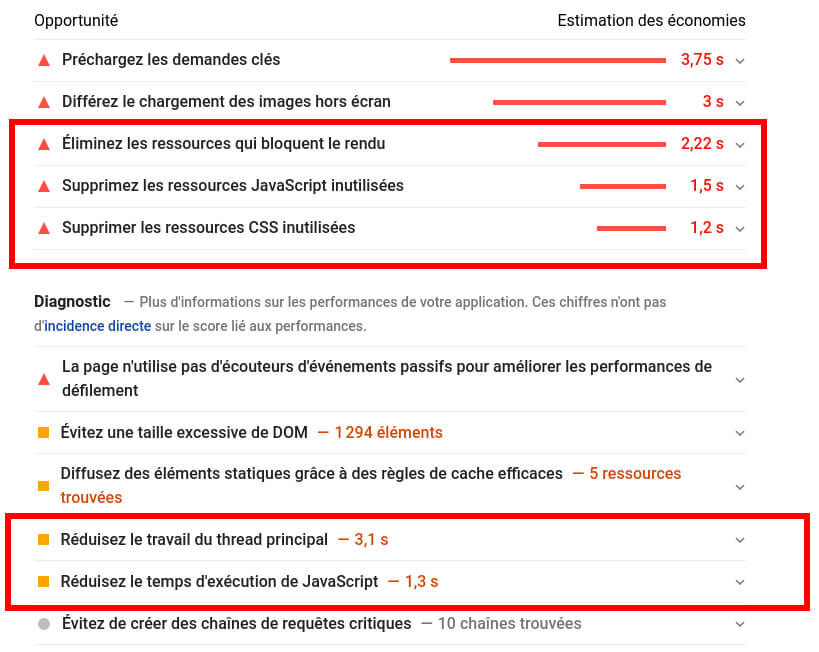
In PSI under the “Opportunities” section, if you see remarks like “Eliminate render blocking ressources”, “Remove unused JavaScript/css resources” or in the “Diagnostic” section things like “Reduce JavaScript execution time” or “Reduce main thread work”, these are the things you need to fix. So click on each of these items to see which files are causing problems and where they are coming from (which theme or plugin).
Once you have identified the items that are likely to deteriorate the FID, follow these steps:
The first question you need to ask yourself is:
Do you really need this plugin/theme that loads those big js/css files?
For example, it is often plugins that display social media widgets, sharing buttons, sliders, popups, animations… that are the source of this kind of problem. The same goes for multipurpose themes that have dozens of different layouts (so huge css files) with widgets and animations to do everything and in the end you only use a tiny part of it. The key to success is in simplicity and you can often do without some of these elements for a more simple solution.
Once you’ve cleaned up and only have what you really need, it’s a matter of prioritizing the JS and CSS files that are really necessary to display the visible part of the page. And that’s where it gets complicated because every site is different. But here are the tools I use to best improve the FID:
- Lazy loade all the below the fold elements. This is of course images but also and especially iframes, videos or audio that often load large js/css files. To do this, I suggest you to use the Lazy loader plugin which is by far the best and which will also allow you to optimize the CLS (I’ll come back to this below). If you use WP-Rocket, a lazyload feature is also available.
- Unload scripts that are loaded unnecessarily on all pages. There are many plugins / themes that load js/css files on all pages while you use for example a contact form only on one page of your site. Personally I take care to load these scripts only on the necessary pages programmatically from the theme. But if you are not a developer, I recommend the Asset Cleanup plugin to do this easily from the administration of your site.
- Delay the execution of scripts that are not essential to the display above the fold elements. It may sound a bit complicated but for example scripts like analytics (analytics.js), tag manager (gtag.js), the script needed to display a gallery, a newsletter, a chat widget and so on… are not needed to display the visible part of the page. I use the Flying scripts plugin to delay the execution of this kind of scripts until the first interaction of a visitor with the page (scroll, click or others). Of course, you have to fill in the scripts to delay by hand but it can have a huge impact on the FID. (Note that this feature is also available in the WP Rocket plugin).
- Load the critical CSS first and delay the rest. If the PSI report tells you that you have a lot of unused CSS resources to remove (i.e. you are loading large css files, most of which is useless for the visible part of the page), consider removing the main source of unused CSS first. If you can’t do that, plugins like WP Rocket or Autoptimize (in paid version) allow you to separate these CSS files into critical CSS (loaded first) and non-critical CSS that are loaded later.
How to measure and improve the Cumulative Layout Shift (CLS) on WordPress
As I explained at the beginning, the Cumulative Layout Shift is a measure of the visual stability of your pages. This means that to improve this score, you must make sure that the visible part of your page (above the fold) is displayed in one go. You must therefore avoid at all costs that elements appear little by little while the page loads, creating layout shifts.
Measure the Cumulative Layout Shifts with PSI
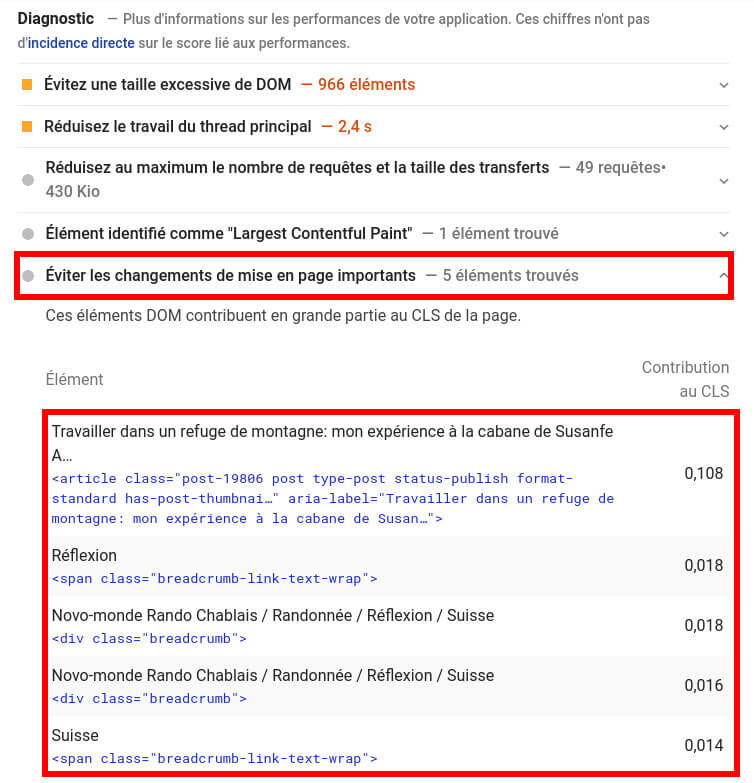
As with LCP, go to the Diagnostics section of the PSI report and look for the “Avoid significant layout changes” note. If you click on it, you’ll get a list of elements on your page that cause layout shifts:
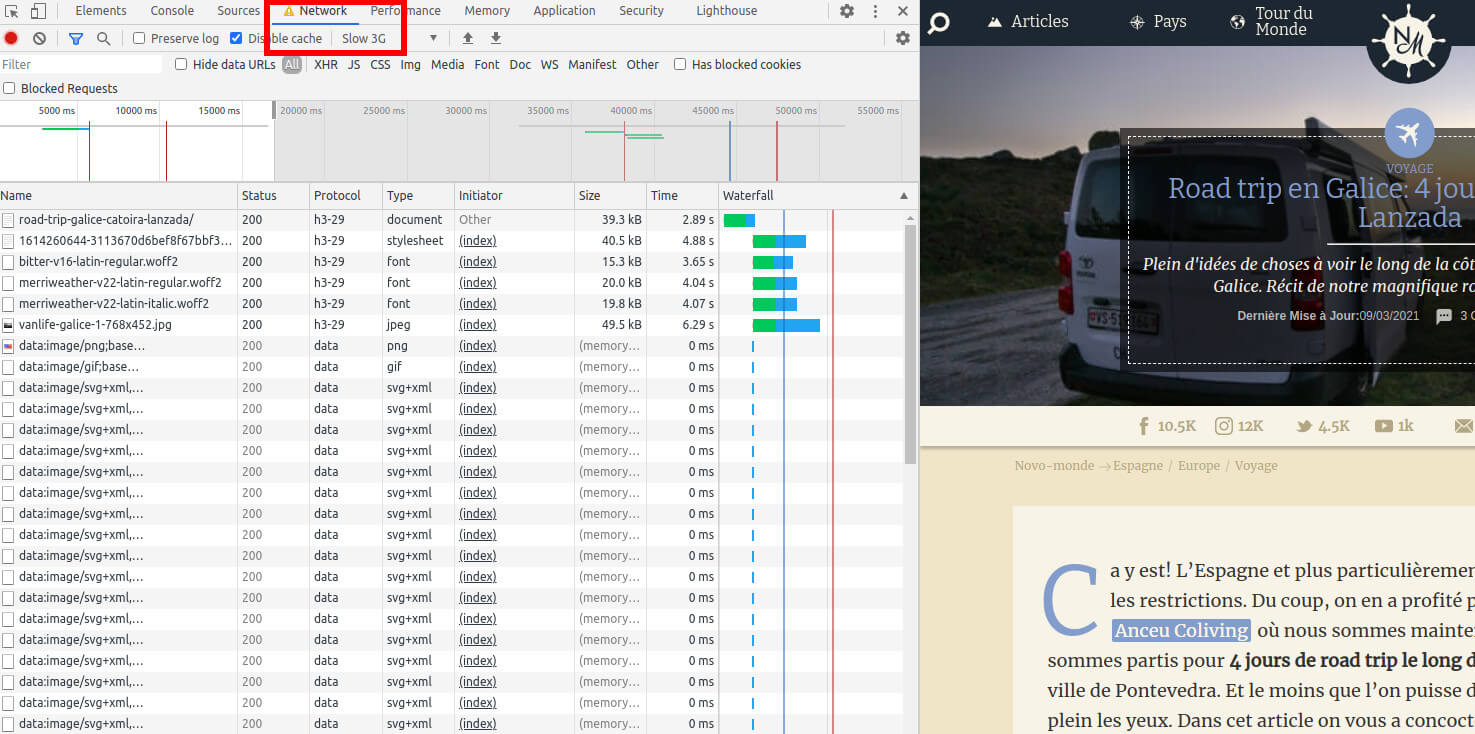
Another more visual way to see the layout shifts when loading a page is to use the “network” tab in Chrome’s developer tools (right click and inspect). In this tab you can choose to load the page with a simulation of a slow 3G connection. This way you will see very clearly where there are shifts in real time.
Improve Cumulative Layout Shift on WordPress
To improve the CLS on your WordPress site there are several things to do:
- Never delay the loading of above the fold elements: I explained above that you should lazyload all elements that are not visible when the page loads (with the Lazy Loader plugin). The thing is that by activating a lazyloader plugin, you will usually delay the loading of all images, even those that are visible on the screen. It is very important to exclude from lazyload the above the fold elements to avoid layout shifts. To my knowledge, this is the main cause of CLS.
With the plugin I recommend, you just need to add the “skip-lazy” class to the elements that should not be lazyloaded. - Specify dimensions of elements like images, videos, iframes, ads: If you see a message like “Image elements do not have explicit width and height” in PSI, it means that you are not specifying the height and width of an image which can create layout shifts when loading. WordPress normally displays the width and height of these elements by default. So you need to identify where the problem is coming from (usually a plugin) and find an alternative that includes the dimensions.
- Avoid adding content dynamically in the visible part of the page: It happens frequently that themes or plugins add elements dynamically (with javascript) in the visible part of the page after the “onload” event. Obviously this will result in an element appearing on the screen after the page has loaded which will have a very negative effect on the CLS score.
- Preload and host your fonts on your server: If the fonts you are using are not loading fast enough (you will usually see the message “Preload key requests” in PSI), either your text will not appear until the font is fully loaded, or the font will change while the page is loading (creating a shift in the display). To avoid these problems, you need to preload and host your fonts on your server. To do this without coding, you can use the OMGF plugin or again, WP Rocket allows you to do this quite easily.
Does WordPress pay attention to Core Web Vitals?

I guess after reading all this you must be thinking that it’s not that easy to optimize a WordPress site for Core Web Vitals… and you’re right! On my side, it took a lot of work to get decent scores in PSI for our blogs.
The main problem doesn’t necessarily come from WordPress itself, but more from the huge amount of developers who create themes, plugins, page builders or others… without thinking about the user experience and the Core Web Vitals. This makes it very difficult for an average user to have the design and features he wants without having a very poorly optimized WordPress site.
But WordPress is not free of all criticism since for the moment Jquery is still loaded by default on all pages and Gutenberg also loads CSS on all pages. However, I have the impression that with its latest versions, WordPress is going in the right direction. The version of Jquery has finally been updated (and maybe one day WP will do without Jquery) and I read here that soon the new Gutenberg editor will load only the CSS of the blocks present on a page (instead of the CSS of all blocks on all pages). So there’s clearly progress on the WordPress side… now it’s up to the theme and plugin developers to follow the movement.
How will Core Web Vitals affect my google search results?

Ahaha this is obviously the question that everyone is asking and it is impossible to answer it precisely before the update of the Google algorithm. But what we can say with confidence is that it is quite rare that Google communicates in advance about its algorithm updates and therefore it is better not to leave Core Web Vitals aside (a bit like with HTTPS if you remember).
The only thing that is certain is that Google will now take into account the Core Web Vitals in its algorithm for mobile and desktop. This means that with the same quality of content, it is probably the page with the best user experience (and therefore the best Core Web Vitals) that will come out first in Google.
Google also announced that “Top Stories” on mobile will now not only show for AMP pages but also for pages that passes Core Web Vitals. So one more reason to optimize these metrics for your mobile site.
In the end, whether it’s to satisfy Google or not, Core Web Vitals are well-chosen metrics that are truly representative of your visitors’ experience on your site. I therefore strongly recommend that you look into the Core Web Vitals topic and improve them to the best of your ability.
And you, have you ever tried to optimize your Core Web Vitals? How did it work for you?


Very thorough and informative, thank you.